Banned industrial solvent sheds new light on methane mystery

This news post is about exciting findings by Matt Rigby and co-authors, which may hold the key to the sudden and unexpected global rise in atmospheric methane following almost a decade in which concentrations had stayed relatively constant. Below is press release published by the University of Bristol on this recent paper: ‘The role of atmospheric oxidation in recent methane growth’ by M. Rigby et al in Proceedings of the National Academy of Sciences

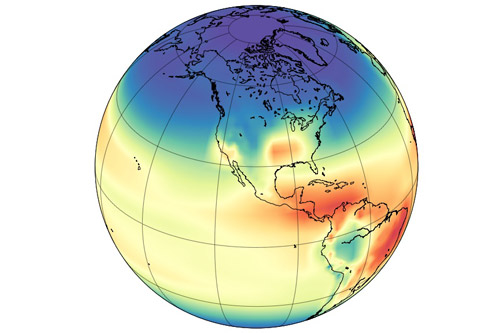
Model simulation of the hydroxyl radical concentration in the atmosphere.

Since 2007, scientists have been searching to find the cause of a sudden and unexpected global rise in atmospheric methane, a potent greenhouse gas, following almost a decade in which concentrations had stayed relatively constant.

Recent studies have explored a range of possible causes. Suggestions have included a rise in oil and natural gas extraction, increased emissions from tropical wetlands or increases in emissions from growing East Asian economies.

However, a new paper by an international team of scientists in the Proceedings of the National Academy of Sciences (PNAS) investigates an alternative possibility: a rise and fall in the concentration of the substance that destroys methane in the atmosphere, the hydroxyl radical.

Lead author, Dr Matt Rigby from the University of Bristol’s School of Chemistry and Cabot Institute, said: “A change in the hydroxyl radical concentration would be a neat explanation for the changes in methane that we’ve seen.

“It would mean that emissions may not have increased suddenly in 2007, but rather, risen more gradually over the last couple of decades.”

Since the global concentration of the hydroxyl radical cannot be measured directly, the team’s findings were made by studying the rate at which the solvent methyl chloroform, which is also destroyed by hydroxyl, was removed from the atmosphere.

Professor Ron Prinn from the Massachusetts Institute of Technology, who co-authored the paper and leads the Advanced Global Atmospheric Gases Experiment (AGAGE), an international project that measures greenhouse gas concentrations, said: “We have been monitoring trends in the methyl chloroform for nearly 40 years because of its role in depleting stratospheric ozone.

“Because methyl chloroform is now banned under the Montreal Protocol for the Protection of the Stratospheric Ozone Layer, we’ve see its concentration drop very rapidly.

“We can examine how this rate of decline changes from one year to the next to infer the hydroxyl radical concentration.”

Dr Steve Montzka from the National Oceanic and Atmospheric Administration (NOAA), who also co-authored the paper, and operates an independent measurement network for methylchloroform, added: “This paper re-examines some of the assumptions that had previously been made in studies of hydroxyl radical and methyl chloroform and shows how they influence our understanding of methane’s atmospheric sink.

“To me, one of the main findings is that our objective analyses of two sets of observations tells essentially the same story, even as it becomes more and more difficult to measure methyl chloroform given that its concentration is approaching zero.”

Dr Rigby added that there was still uncertainty remaining. He explained: “Whilst there are strong hints in our study that hydroxyl radical changes could be playing a significant role in the fluctuations in methane growth, our uncertainties are very large.

“In future, we need to think about new ways to reduce this uncertainty, if we are to truly understand changes in atmospheric methane.”

The study also lead to a more certain, but unexpected finding: that emissions of methyl chloroform had not dropped to zero.

Dr Rigby said: “Because its production is now banned globally, we were expecting to see no emissions of this substance at all. However, we have very strong evidence that emissions are continuing.”

The team are preparing a follow-up study that would determine where these emissions are originating. Meanwhile, they are continuing to monitor methane in the atmosphere, and are waiting to see whether its current rate of increase will continue.

Ponds in the Pantanal

Our next post from the field comes from Luciana Gatti and Manuel Gloor, who have been measuring how much methane is found over the Pantanal region of Brazil. This is a huge area of wetlands, and is therefore also a huge source of methane. 


Luciana Gatti and Manuel Gloor with the pilots of the light aircraft

Luciana Gatti and Manuel Gloor with the pilots of the light aircraft

We, Luciana Gatti and Manuel Gloor, have just returned from the Pantanal area where we have started sampling of the vertical air column (0 to 4.5 km height above sea level) using light aircraft (see the first photo) for subsequent analysis for CH4 at Luciana’s laboratory.
The mosaic of circular ponds in the Pantanal

The mosaic of circular ponds in the Pantanal

The Pantanal is one of the largest wetlands worldwide with an areal extent on the order of 150,000 km². It is a flat area which drains very slowly via a complicated system of ponds feeding each other as well as some slowly moving rivers. The region is seasonally flooded and has seen major precipitation maxima in recent years but also sometimes drier phases. It is a potential candidate region for a climate change methane emissions feedback.
An area of flowing water in the Pantanal

An area of flowing water in the Pantanal

The mosaic of circular ponds can be very clearly seen from the aircraft (photo 2) as well as occasionally flowing water areas (photo 3). If one looks really, really carefully one may even spot a hungry caiman or two. The vertical air profile has already been analyzed for greenhouse gases and reveals a major methane source which reveals itself as a large concentration enhancement within the lowermost 2 km above ground.

Smoking savannah fires from the first MOYA flight campaign

A few weeks ago, the MOYA team completed the first campaign on the Atmospheric Research Aircraft (run by FAAM). I was not in the field in Senegal, but instead I was doing weather forecasting, flight planning and monitoring of the data from back home in the UK. Although there was no wiggle room in the packed schedule, the team managed to get in 4 exciting science flights, and saw different things in each one! Here’s a rundown of what they got up to…

Photo Credit: Axel Wellpott.
Sampling over a forest fire in Senegal from the FAAM aircraft

On Tuesday 28 February 2017, they flew inland over a region of forest fires in Senegal. We wanted to sample the emissions from these fires, and they managed to do just that! The picture below shows some of the methane, carbon dioxide and carbon monoxide traces along the flight track. The big spikes show the places where they flew through the fire plumes. They saw huge spikes in all these gases – up to 500 ppb extra of methane, on top of the usual 1850 ppb in this region in this season. That’s about an extra 27%!

Measurements shown on a Google Earth map

Flight 1: Methane, carbon monoxide and carbon dioxide measurements from a flight over forest fires burning in Senegal shown on a Google Earth map.

We should be able to find out a lot about what gases and particles are in these fire plumes when we analyse these measurements – I’m not sure if anyone has ever flown directly over the fires to measure the emissions before! Some of the air inlets experienced a smoky smell and some strong turbulence from the heat from the fires, as well as a bird strike. All in the name of science!

Photo Credit: Euan Nisbet. Inside the FAAM atmospheric research aircraft

Photo Credit: Euan Nisbet.
Inside the FAAM atmospheric research aircraft – all eyes to the screens.

Next morning, the crew flew back over a similar region of the Casamance, and this time the visibility was very poor. You can see from the photo just how smoky it was. Sampling these fires two days in a row will allow us to find out how variable the emissions are from day to day.

Photo credit: Euan Nisbet. Smoke from the fires in the Casamance region of Senegal.

Photo credit: Euan Nisbet.
Smoke from the fires in the Casamance region of Senegal.

After refuelling in Dakar, the next flight was off the coast, with the aim of sampling fire emissions as they are blown out to sea. The measurements showed there were layers with high levels of ozone, carbon monoxide and nitrogen oxides as well as moderate methane, which may well have been from the fires. The figure below shows the carbon monoxide (CO) levels as the aircraft flew back and forth at different heights. At 5000 feet, there’s a layer of high CO that isn’t present above or below that height. The next day, they flew off the coast again and measured something similar, which one scientist called a “complex sandwiched air mass”!

Carbon monoxide levels along the flight track are shown by the colours. High levels at 5000 feet were sandwiched in between cleaner air.

Credit: Axell Wellpott.
Carbon monoxide levels along the flight track are shown by the colours. High levels at 5000 feet were sandwiched in between cleaner air.

Dr Grant Allen, one of the lead scientists on the flights, said of the experience:

“The flying was very challenging (and exciting!). Flying as low as 500 ft over the savannah and through intense fire plumes is a rare experience for most and I’ll admit to being nervous on occasion. However, the professionalism of FAAM and the expert training of the pilots and aircraft engineers means we are always in safe hands. The team recorded the most intense sampling (vertically) of a near-source fire plume ever performed with the FAAM research aircraft and the data will keep the science team busy for many months and years to come. We expect to analyse the carbon-isotopic fractionation of biomass burning signatures for this crucial regional methane source and provide new chemical and aerosol measurements of fire plumes.”

So started the first of the MOYA flight campaigns. We are all hoping we will have the same success and luck in the future!

– Dr Michelle Cain, University of Cambridge

Project MOYA – NERC’s study of the global methane budget

In 2016, NERC began support for Project MOYA, a major study of methane in the Earth’s atmosphere. MOYA – or Methane Observations and Yearly Assessment – is a major consortium between 14 UK universities and Research institutions, brought together as a NERC highlight project to study methane in the global atmosphere. “MOYA” means ‘wind’ or ‘breath’ or ‘spirit’ in some southern African languages, appropriate for a project focused on methane, part of the breath of the biosphere.

Methane, or CH4, is a very important greenhouse gas, second only to carbon dioxide, CO2, in its contribution to human-induced global warming. Its overall warming impact since human industrialization began is more than half that of CO2, but it has had much less attention from policymakers.

Molecule for molecule, methane is a much stronger greenhouse gas than CO2 but, in contrast to CO2 emissions, which effectively increase the amount in the air for centuries, methane is only in the air for less than a decade before it is oxidized to CO2. Thus effective measures to bring down methane will have rapid impact – it is a very attractive target for emission reduction efforts.

Methane emissions are both natural and human-induced sources. Major natural sources are the great tropical, boreal and Arctic wetlands of the world, including the equatorial Amazon and Congo wetlands, the seasonal savanna swamps such as those in Bolivia, Paraguay, Zambia, South Sudan, etc, and, in summer, the vast wetlands of Canada and Siberia.

Papyrus swamp, Kajjansi, Uganda. Equatorial swamps are major methane emitters.

Photo Credit: EG Nisbet.
Papyrus swamp, Kajjansi, Uganda. Equatorial swamps are major methane emitters.

Human sources include gas leaks from the natural gas industry (gas is mostly methane), the coal and oil industries, and also from biomass burning, as well as waste disposal landfills, and sewage plants. Ruminant animals, which ferment plants in their foreguts, are major emitters – cows, water buffaloes, sheep, etc. (note it’s from the front end of the cow: ‘bovine eructation’ – not much is from the flatulent end!). The main sink of methane is atmospheric OH (water minus a hydrogen) in the air, especially in the brightly sunlit tropical atmosphere a few km above sea level. Soils also removes methane, as does chlorine from sea spray.

There is much uncertainty about the methane budget, as we don’t know how much methane is being made. So called ‘bottom-up’ inventories, made by totaling up all the local estimates of emissions, are significantly larger than ‘top-down’ studies made by measuring how much methane is actually in the air. But a great deal of methane is certainly emitted. In comparison to CO2, which has only gone up by a factor of somewhat over a half since King George III ruled Britain and North America, the amount of methane in the air has increased by about two and a half times.

Canadian wetland, near Fraserdale, Ontario. Boreal wetlands like this, often made or enhanced by beaver dams, are very extensive and emit much methane in summer.

Photo Credit: EG Nisbet.
Canadian wetland, near Fraserdale, Ontario. Boreal wetlands like this, often made or enhanced by beaver dams, are very extensive and emit much methane in summer.

In the 20th century, methane grew rapidly, but by about the year 2000 it had effectively attained equilibrium in the air, with sources matching sinks. During the rapid growth in the 20th century, the proportion of the carbon-13 isotope in the methane in the air had increased steadily. Now carbon-13 is somewhat richer in industrial gas and gas from fires, while carbon-12 is preferred by biological processes, so the carbon 12:13 ratio of methane is a powerful way of finding out where the methane came from. Methane from fires and fossil fuel leaks is somewhat richer in C-13 (‘heavy’), while methane from swamps and cows is slightly more C-12 rich (‘light’).

Atmospheric methane concentrations have increased sharply since 2007, and dramatically in 2014, 2015 and 2016, with especially strong growth in the tropics. Simultaneously, the methane in the air has become more depleted in carbon-13 relative to carbon 12, which implies that the cause of the growth is not emission of methane from fossil fuel industries such as natural gas or coal, nor is it emitted from biomass fires. Methane’s growth is now so significant that is threatens to make it much more difficult to keep global warming below the 1.5oC goal and 2oC target of the United Nations’ Paris Agreement signed in 2015.

We do not fully understand why methane is growing so fast. It may be that tropical wetlands are emitting much more methane? Or perhaps tropical cows are breathing out more? Or has the largest methane sink, which is atmospheric hydroxyl, changed so that destruction of methane has reduced?

– Professor Euan Nisbet, Principal Investigator for MOYA, Royal Holloway University of London

Photo Credit: EG Nisbet.
The methane kill zone, in the moist tropical mid-troposphere, where the main sink, OH, destroys methane.

More information about the project

Project MOYA is NERC’s ‘Highlight’ study, designed to answer some of the questions around methane. The focus is the Global Methane Budget – finding out methane’s sources and sinks, and what controls its growth. The 14 partners include Univ. East Anglia, Univ. Exeter and Plymouth Marine lab, British Antarctic Survey, Univ. Manchester, Univ. York, Univ. Leicester, NERC Centre for Ecology and Hydrology, Open Univ., Univ. Aberdeen, Univ. Leeds, Univ. Bristol, Univ, Cambridge, and the National Centre for earth Observation and Univ. Edinburgh. The project is led by the Earth Science Dept at Royal Holloway, Univ. of London. It is a follow-up to NERC’s recent highly successful MAMM project, studying the methane budget of the Arctic.

There are various parts to MOYA – observation, field process studies, and computer modelling of the global budget.

Better Observations are needed to derive estimates of emissions. The project will support a wide observation network for methane and its isotopes. Continuous stations will be at Kjolnes (Norway), Weybourne, Jersey, NERC ship RRS JC Ross, Cape Verde, Ascension, Falklands, Halley Bay, and Hong Kong, with associated stations in Canada, Spitsbergen, Bolivia, South Africa, India, Rwanda and Malaysia. Flask or bag sampling (for methane, 13C and D/H isotopes) will also be undertaken at these stations and at a number of continental stations in S. America, Africa and S, SE and E Asia, with offline analysis in the UK.

In addition, the UK FAAM aircraft will carry out flights across the Atlantic tropics, from Azores to Cape Verde to Ascension.

In parallel to the observational work, field campaigns will be carried out to study emissions hot spots. Field campaigns will be undertaken in tropical wetlands in Amazonia, Africa, India and SE Asia, and in the great savanna grassland regions where intense seasonal dry season biomass burning occurs. Land surface modelling will also be improved, so we have a much better understanding of which types of plants grow where, and why. Work will also be carried out to identify industrial emissions, and develop ways of reducing them, to help the Paris Agreement reach its target.

To interpret all these data inputs, MOYA will also support major computer modelling studies, to work out how much methane is being emitted in each region and across the planet as a whole, to test and improve the top-down and bottom-up emission estimates, and to try to find out why methane is increasing.

Reference:

Nisbet, E. G., et al. (2016), Rising atmospheric methane: 2007–2014 growth and isotopic shift, Global Biogeochem. Cycles, 30, doi:10.1002/ 2016GB005406.
http://onlinelibrary.wiley.com/doi/10.1002/2016GB005406/epdf (PDF, open access)


Welcome to the MOYA blog

Hello and welcome! Here, the MOYA team will publish blogs about the project. Next up will be our first in depth introduction to the project, by the project’s principal investigator, Professor Euan Nisbet.

Find out more about the project by using the menu at the top of the page.