By Dave Lowry, Tim and Trish Broderick, Musa Lambakasa, James France, Stéphane Baugitte
Photos by Tim and Trish Broderick and Dave Lowry
The first ZWAMPS campaign consisted of both aircraft and ground surveys, these being linked most closely in the Kafue Flats region over the period Feb 2 to 5. The Kafue Flats are a floodplain wetland, extending from Itezhi-Tezhi Dam in the west, some 240 km east to Kafue town and never more than 50 km wide (https://en.wikipedia.org/wiki/Kafue_Flats). The river has changed course many times across its plain leaving scattered oxbow lakes and isolated snake-like sections of meanders to stagnate outside of flood season (Fig. 1).
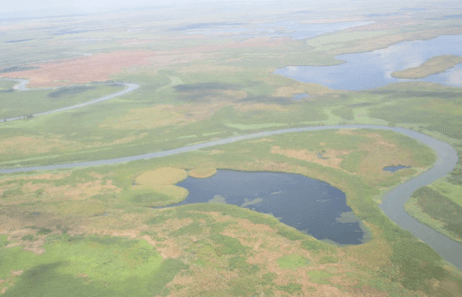
Fig. 1 River Kafue lakes and meanders.
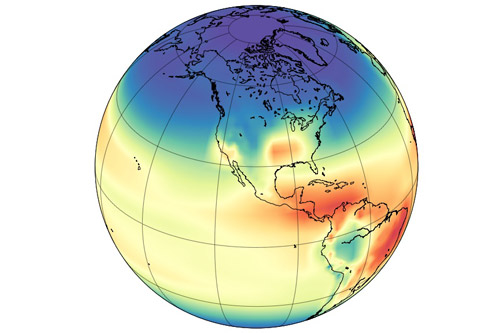
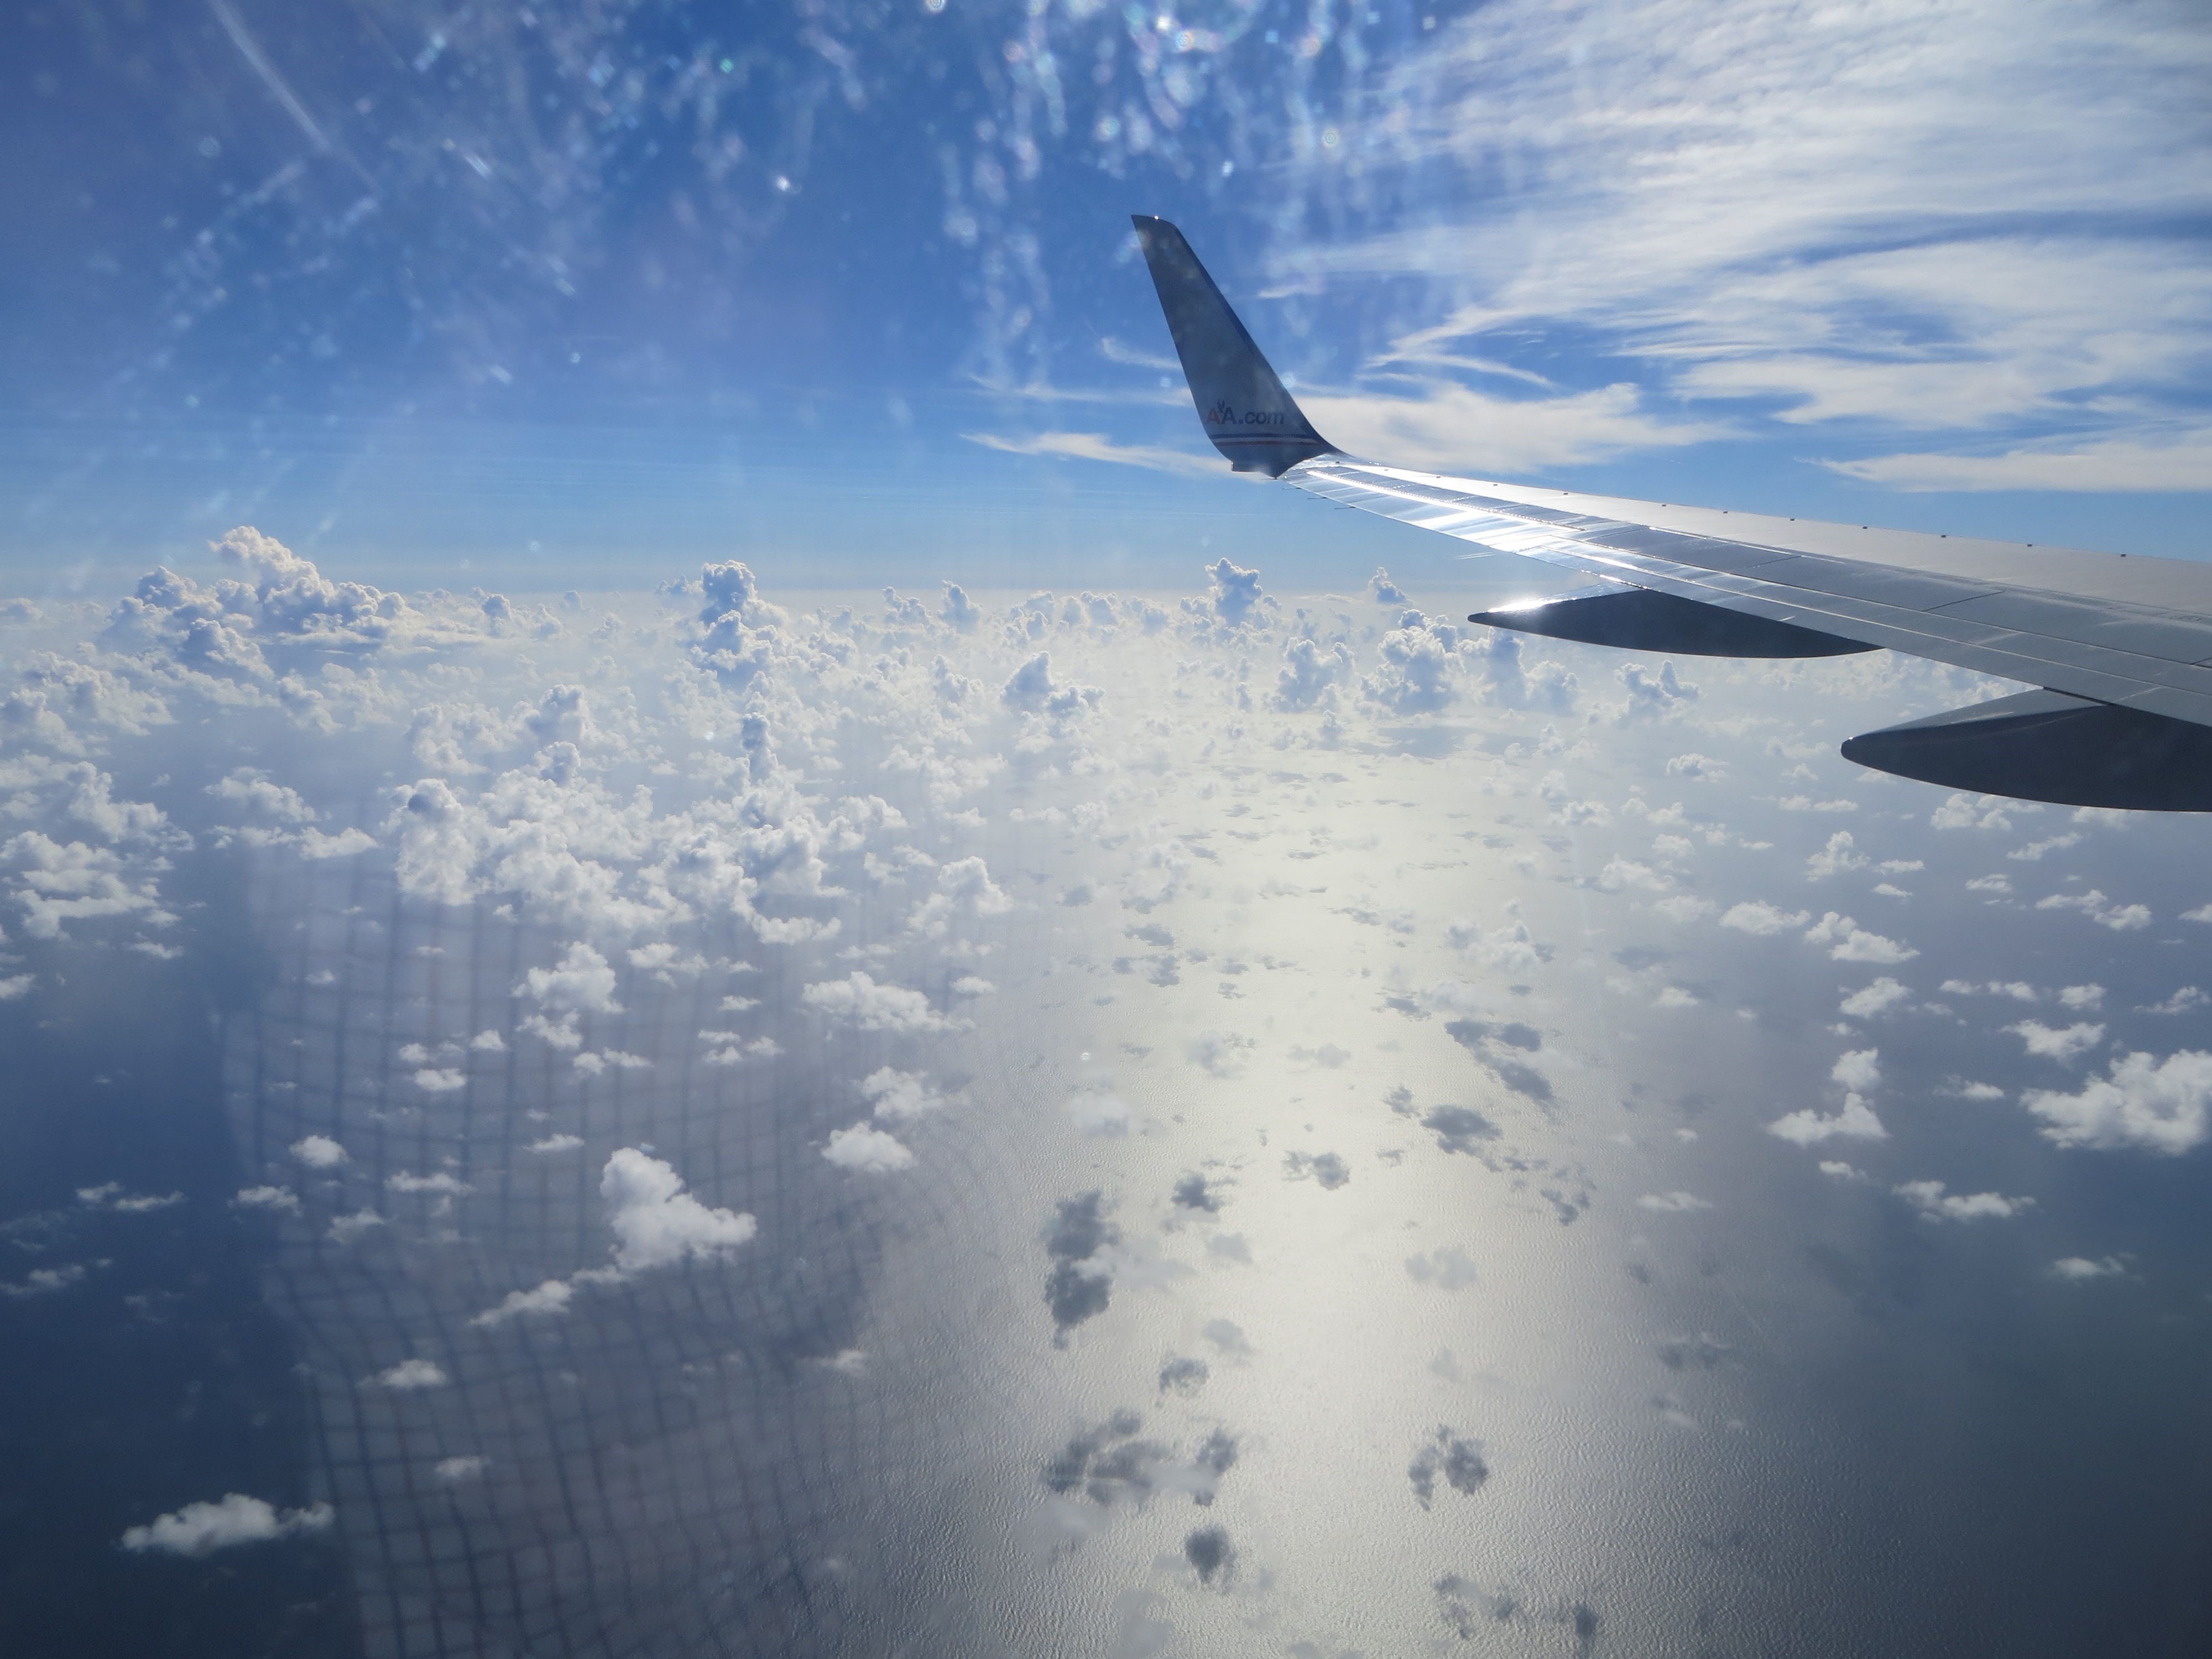
The surveys and sampling commenced on Saturday with an intensive 4-hour zigzag flight over the region, designed by Keith Bower (Fig. 2), with elevated methane noted toward the eastern end near the start of the flight, before vertical mixing reduced these signals. The flight was very much enjoyed by Tim and our Zambian Ministry of Mines group, including Musa. Separating out the wetland source from the flight measurements and isotope data will be quite difficult because there were also numerous rural cattle herds and very extensive burning plumes producing methane (Fig. 3).
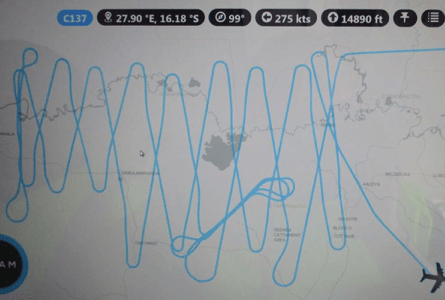
Fig. 2 End of the zig-zag flight
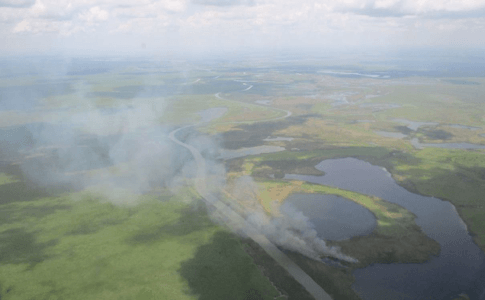
Fig. 3 Biomass burning plumes close to river
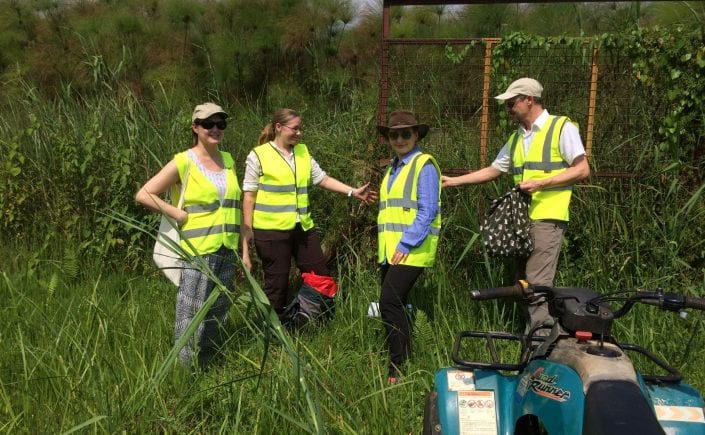
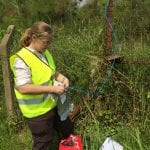
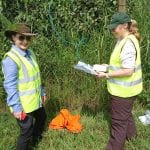
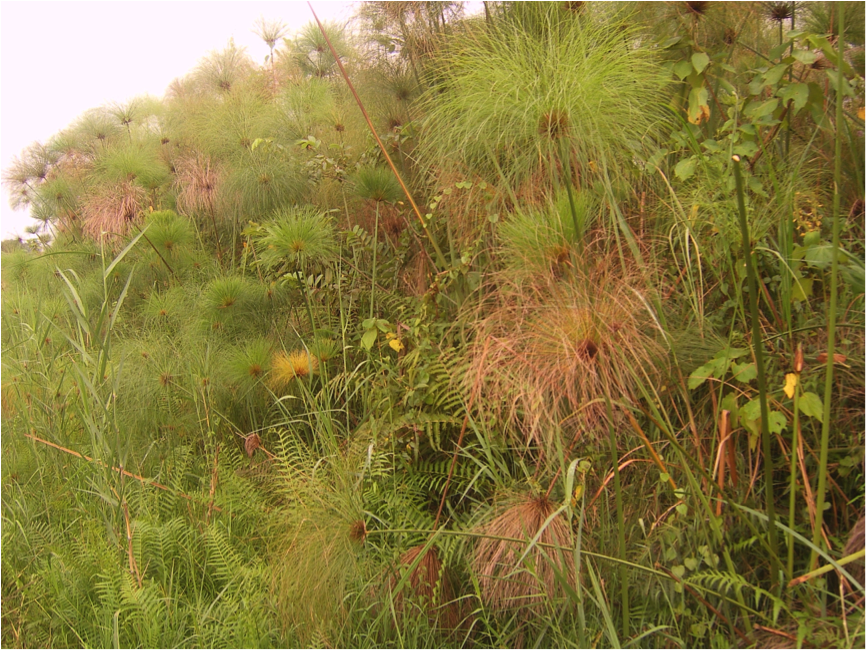
On Sunday we attempted to find our way by road to the northern margin of the Kafue Flats through the Blue Lagoon national park. After a 3-hour drive from Lusaka we reached a faded sign saying Nakeenda Lodge 9 km. The national park sign was even more rusted. Soon we realised that this part of the park had not been visited for a long time as the track became more an overgrown and very muddy path, so we decided to sample air from a dambo in the pristine savanna (Fig. 4). The site was full of butterflies of numerous species, and even a praying mantis was catapulted into the car as we brushed past the luxuriant vegetation (Fig. 5).
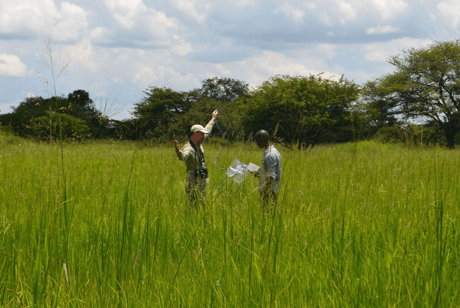
Fig. 4 Stéphane directing air sampling

Fig. 5 Mantis on water bottle
Undeterred we decided to approach the park from the NW corner and reached a barrier. Here the head park ranger directed us to the managed game area and wetland. After a few kilometres we turned off along a narrow track not on maps or GPS. Then followed 20 km over 90 minutes down a narrow and churned up track. As we passed across the invisible park boundary we came to a fishing camp on a rise above the floodplain and its associated biting insects. We were greeted by excited children and an ox cart (Fig. 6). Turns out that we were still some kilometres from the river, the resident lechwe antelope or the Game Ranger patrol camp. At this point we realised we had to get back to Lusaka before dark.
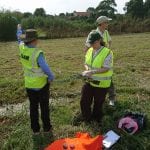
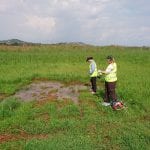
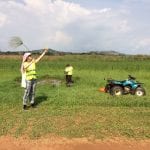
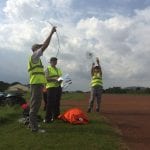
The return was no quicker, especially being interspersed with air sample collection in the pristine national park grassland (Fig. 7), as we carefully traced our way back along interweaving tracks using the GPS. We approached the outskirts of Lusaka as night fell, and on a road without lighting, carefully negotiated many minibuses without lighting and pedestrians bustling across the road to lively markets. Alarm bells had been ringing back at base when we failed to arrive back for the evening briefing and our Blue Lagoon destination was all that was known. As the city approached and phone reception returned we were able to let all know we had not broken down in the bush.
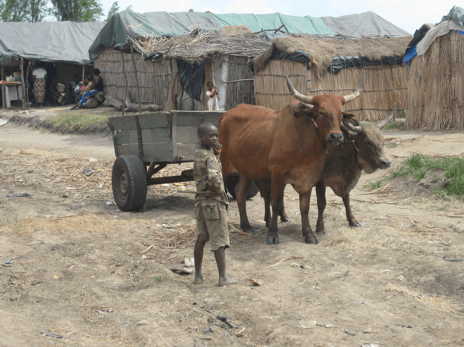
Fig. 6 Ox cart and children in the camp
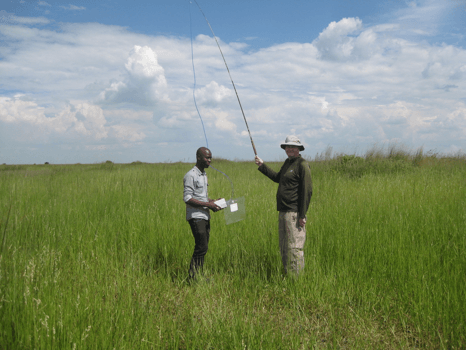
Fig. 7 Musa and Dave fishing for air
On Monday we had planned to sample on the south side of the floodplain, overnight in the Relax Hotel in Monze and then meet up with Mike Daly at the Lochinvar hot springs on Tuesday, but after breakfast Tim noticed that the Ford had a rear puncture from our toils the previous day, which fortunately hadn’t materialised on the evening drive back. Tim headed off hoping for a quick fix, but a brake fluid leak was also discovered from a distorted and corroded seal. Many discussions and calls later a replacement vehicle was delivered at 6 in the evening.
Plans quickly changed and the proposed rendezvous with Mike was scrapped due to the long distance, and the focus for Tuesday was to get into the sugar cane plantations and wetlands near Mazabuka. All was fine until about 2 hours into the drive when, on probably the steepest hill climb on the Kafue-Livingstone main road, there was a load bang from the rear of the vehicle. This time a major blow out and a 3 cm long rip in the tyre. Tim and Musa got to work on the jack while we jammed the other wheels with some lovely roadside calc-silicate boulders. Convoys of lorries heading for Botswana and South Africa laden with copper and other goods struggled past us. It soon became apparent that the supplied jack was not high enough for our Landcruiser, but we managed to flag down a local farmer and get the change done.
That’s when we noticed a 1cm diameter, perfectly round hole through the alloy wheel below the rip in the tyre, with a very clear entry and exit direction from a high velocity impact (Figs. 8 and 9). None of us had seen anything like that before and we still don’t know the cause, so we will leave this to your imagination.
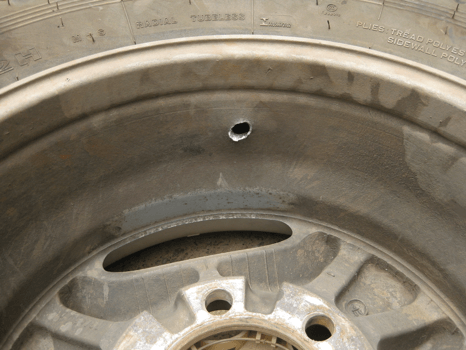
Fig. 8 Hole in the alloy wheel – inside view
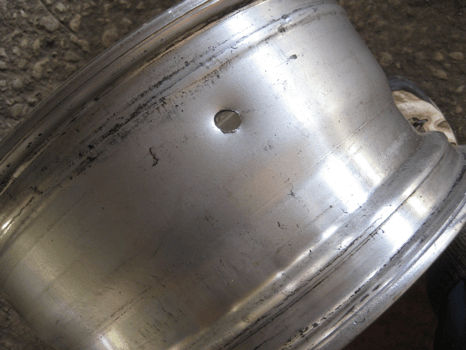
Fig. 9 Hole in the alloy wheel – outside view
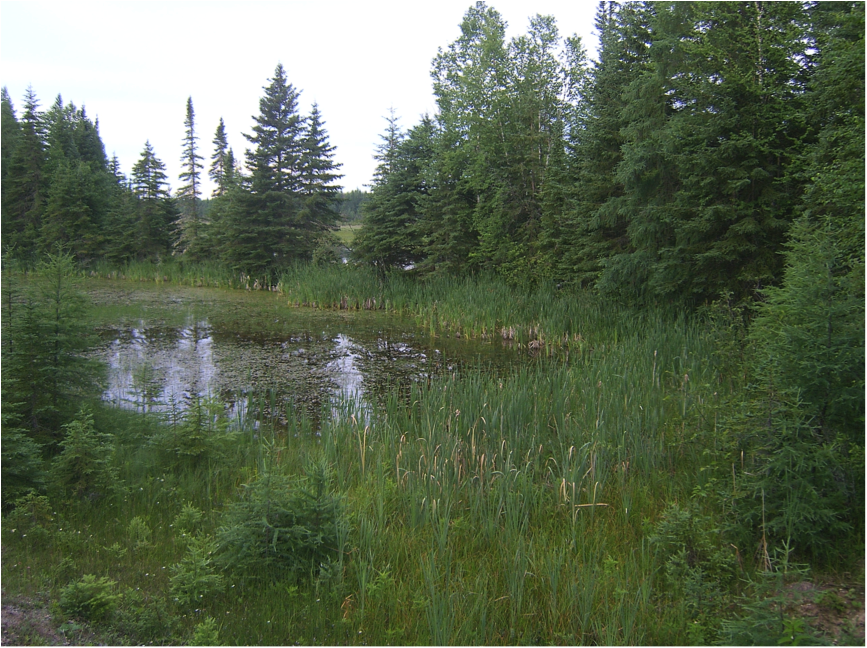
At Mazabuka we found a tyre repairperson and then followed a wild goose chase to find a welder, then through sugar cane plantations to a market for electrodes, which then didn’t work because the alloy was wrong and required a DC current. After 2 more lost hours, we had a reality check, dumped the wheel and tyre into the back and decided to risk it on the spare and take the 30 km of dirt tracks NE toward the wetlands and river. With co-ordination of aerial images and GPS we headed down a narrow track and finally came to lush vegetation, reed beds (bulrushes) and clusters of water lilies, before the track stopped abruptly in a small clearing populated by a group of fisher folk. We proceeded to collect air samples from different heights in the reed beds. In the midst of this the reeds seemed to part and a small canoe cruised into the bank laden with good-sized Kafue bream (Figs. 10 and 11).

Fig. 10 Boatmen in the reed beds
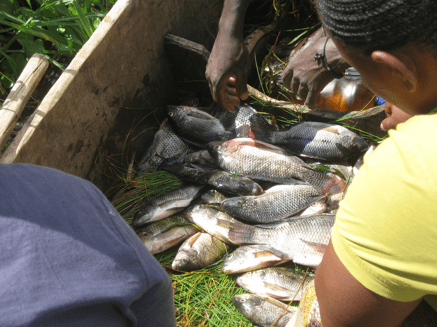
Fig. 11 Cargo of Kafue bream
The drive back was far less eventful. The next morning the car hire people inspected the wheel and seemed overly keen to give us our deposit back and get us on our way. We can certainly look back on a couple of eventful and somewhat surreal days that we won’t forget in a hurry and hope that the few highly prized air samples were well worth our efforts to collect them.